How Britain Eats: The UK’s Food Spending Habits Revealed

Written by
Emily Tye
Reviewed by
Amy LancashireWhether it’s supermarket loyalty, takeaway preferences or daily coffee runs, food shopping habits can reveal a surprising amount about how people across the UK live, work and spend.
As food prices continue to rise, shopping habits are changing rapidly. Recent research found that two-thirds of UK households have changed the way they shop or eat in an attempt to cut food costs, with many consumers opting for cheaper products, supermarket own-brand ranges and promotional offers.
To uncover how Britain’s food habits differ across the country, the experts at Zable analysed internal consumer spending data across supermarkets, fast food chains and coffee shops. By analysing transaction volumes, spending patterns and purchase timings across major retailers, we uncovered which brands dominate in different parts of the UK.
Where Britain’s supermarket habits reveal the biggest regional divides
Britain’s supermarket habits reveal a growing divide between convenience-led premium shopping and value-focused household spending.
Merchant | Overall Market Share |
|---|---|
Tesco | 33.60% |
Sainsburys | 14.88% |
Asda | 14.41% |
Morrisons | 10.73% |
Aldi | 10.50% |
Lidl | 9.53% |
M&S Food | 4.71% |
Waitrose | 1.65% |
Tesco is revealed as the nation's favourite supermarket based on Zable’s data, accounting for over a third (33.6%) of all supermarket transactions analysed. This is followed by Sainsburys and Asda who take up 15% and 14% of transactions respectively.
Interestingly, when digging into the data, it shows shoppers across the UK are using supermarkets in very different ways.
When looking at how different generations shop, more than a third of all Zable transactions at Waitrose (35.6%) and Marks & Spencer Food (34.6%) come from shoppers aged over 50, giving both retailers the oldest customer base of any supermarket analysed.
Meanwhile, Aldi, Lidl and Asda all see their strongest engagement among 40 to 49-year-olds, suggesting middle-aged households remain the consumers most focused on balancing rising grocery costs with larger weekly shops.
Regional trends reveal an equally stark north/south split in supermarket loyalty. Sainsbury’s performs particularly strongly in London, where it accounts for almost a quarter (24.9%) of all supermarket transactions, while Asda sees its strongest market share across northern and post-industrial towns and cities.
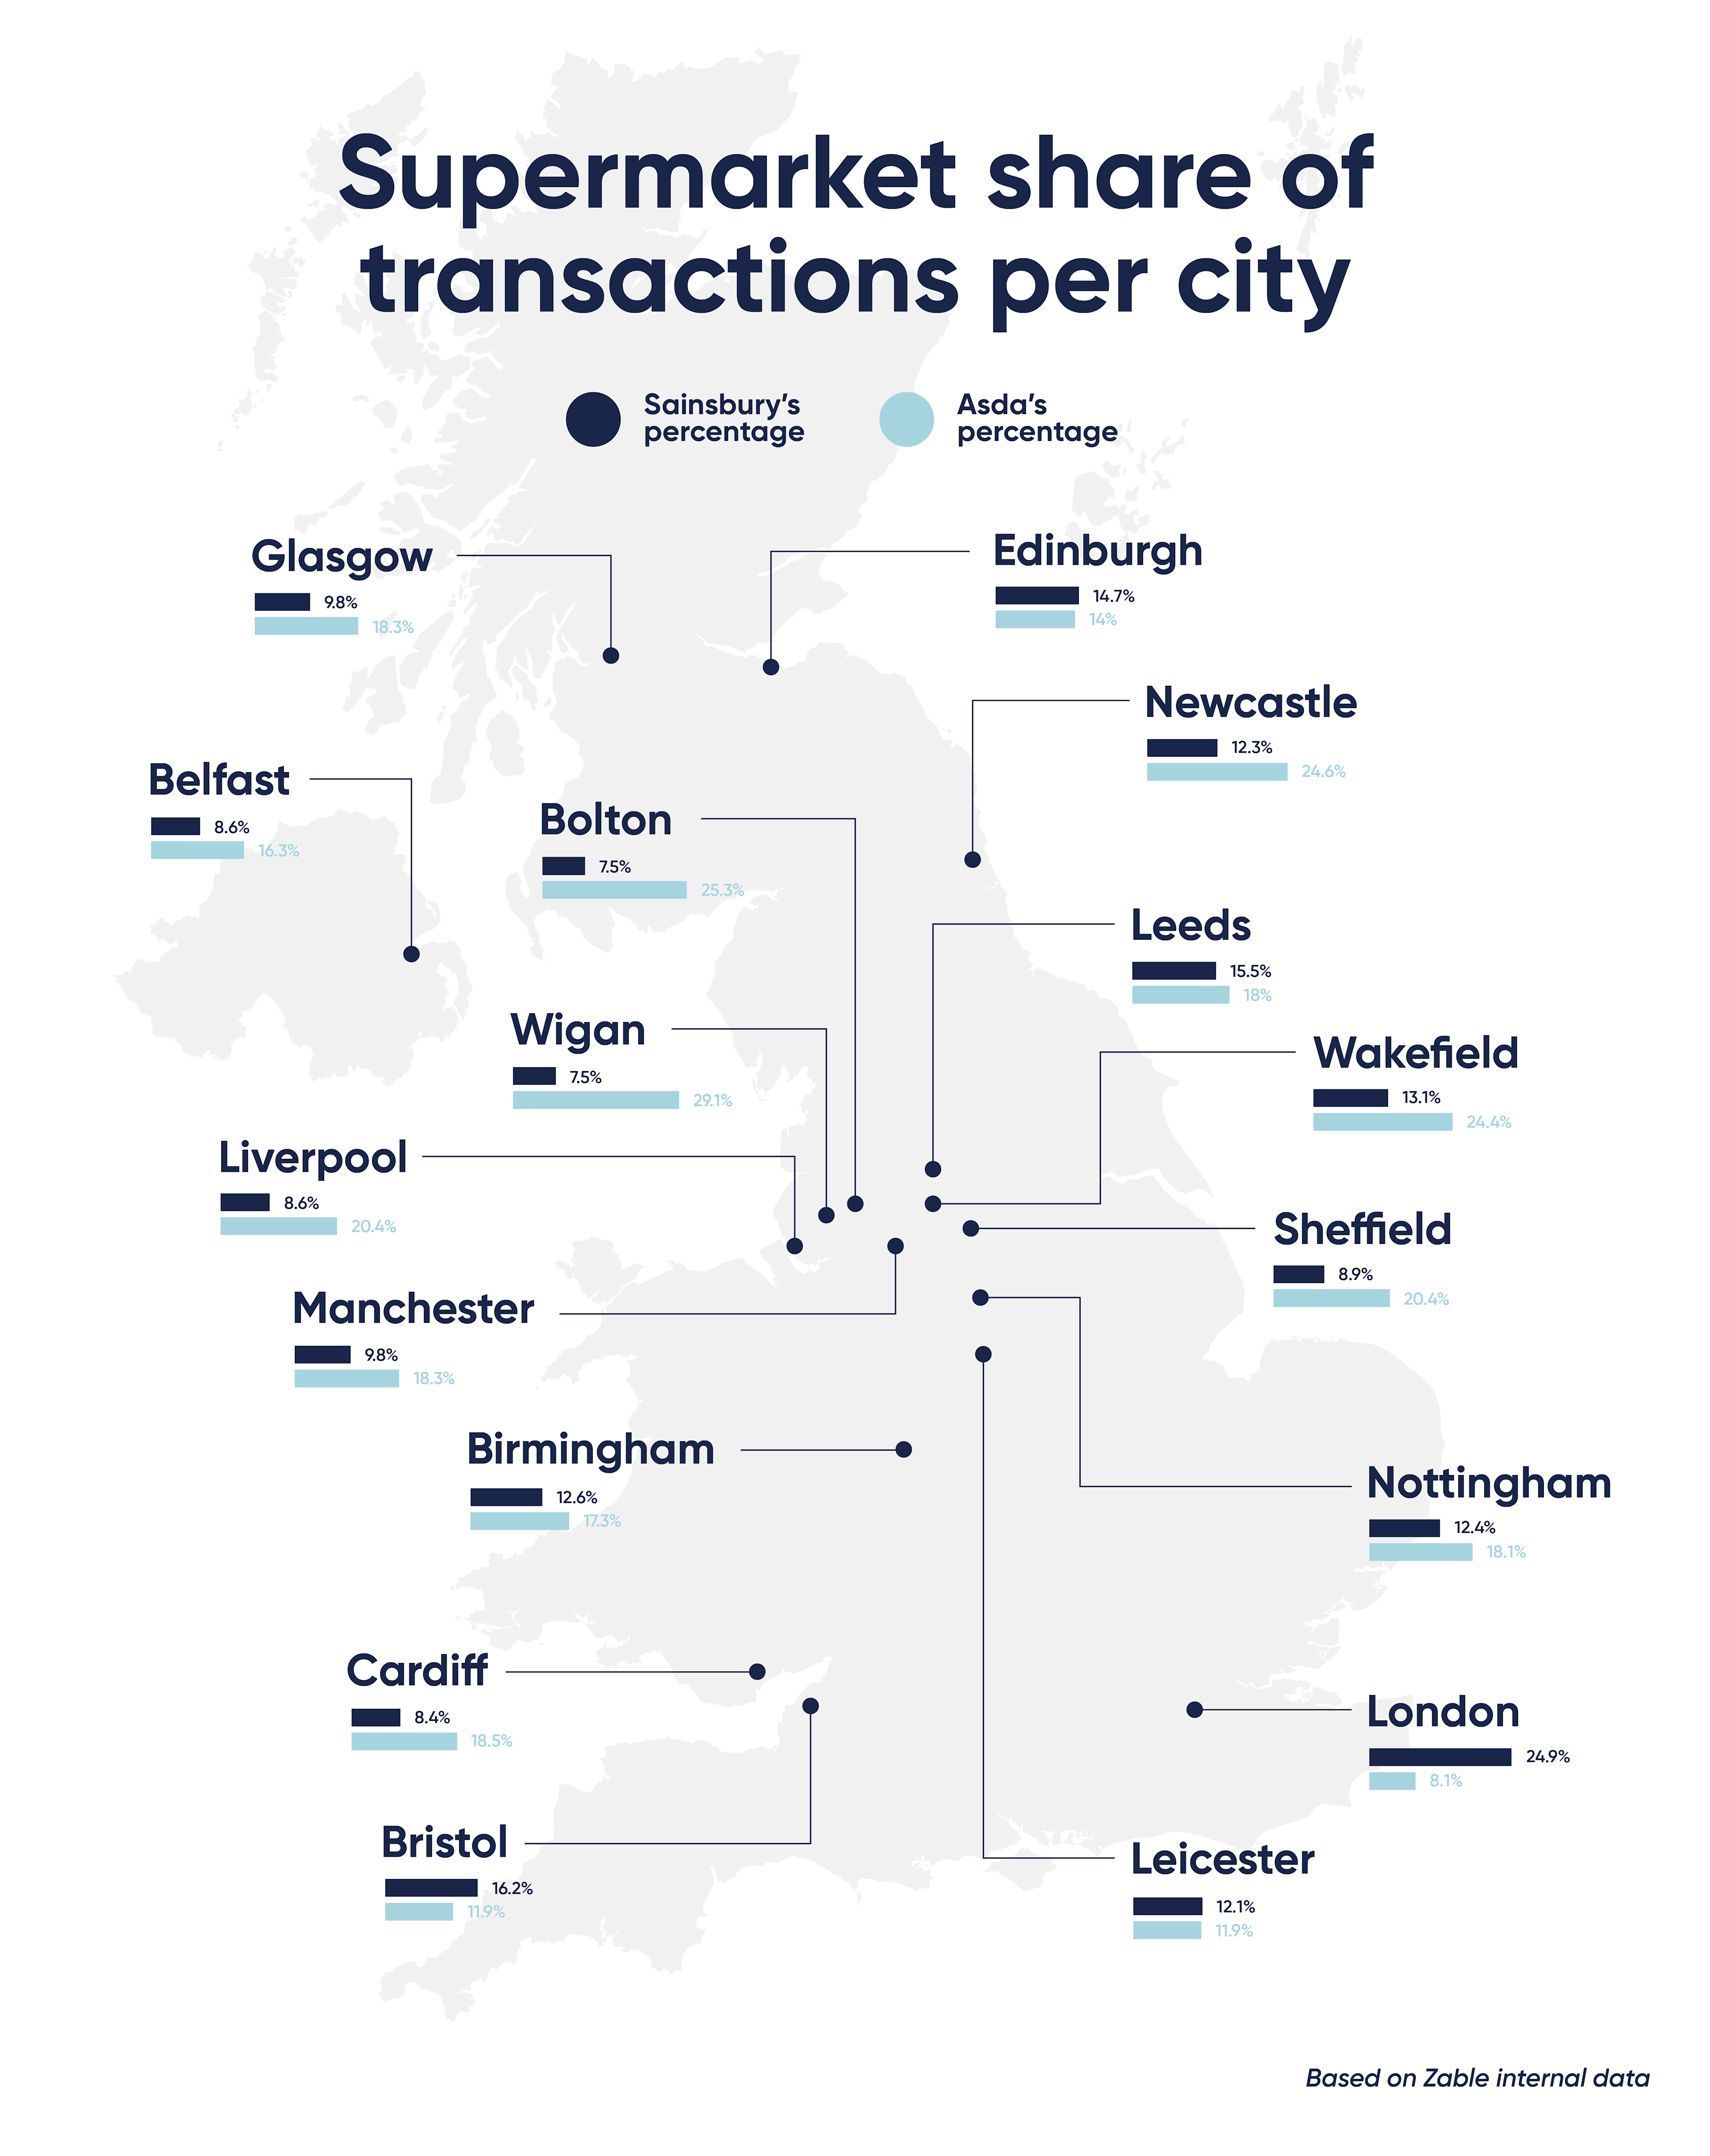
In Wigan, nearly three in ten supermarket transactions (29.1%) take place at Asda, while the retailer also leads in locations including Newcastle, Bolton and Wakefield.
McDonald’s dominates Britain’s fast food baskets according to Zable data
Britain’s fast food habits appear far less divided than its supermarket preferences, with McDonald’s overwhelmingly dominating consumer spending across almost every part of the country when it comes to Zable transactions.
Merchant | Overall Market Share |
|---|---|
McDonalds | 73.9% |
KFC | 13.5% |
Dominos | 7.4% |
Burger King | 4.6% |
The chain accounts for nearly three-quarters (73.9%) of all nationwide fast food transactions on Zable credit cards. In some towns and cities, McDonald’s dominance becomes even more pronounced, accounting for close to 8 in 10 fast food transactions.
The brand performs particularly strongly across locations, including Blackburn (81%), Norwich (79.9%), Hull (79.4%) and York (79.2%), reinforcing its position as Britain’s clear fast food leader.
Whilst McDonald’s sees its busiest transaction period at midday, highlighting its role as a go-to option for lunch and quick daytime purchases, Domino’s strongest transaction activity takes place later in the evening.
The pizza chain also reveals one of the clearest regional divides in the data. Southern cities including Oxford (13%), Guildford (11.9%), Bath (11.8%) and Southampton (11.6%) rank among Domino’s strongest-performing locations, where the chain accounts for more than 1 in 10 fast food transactions.
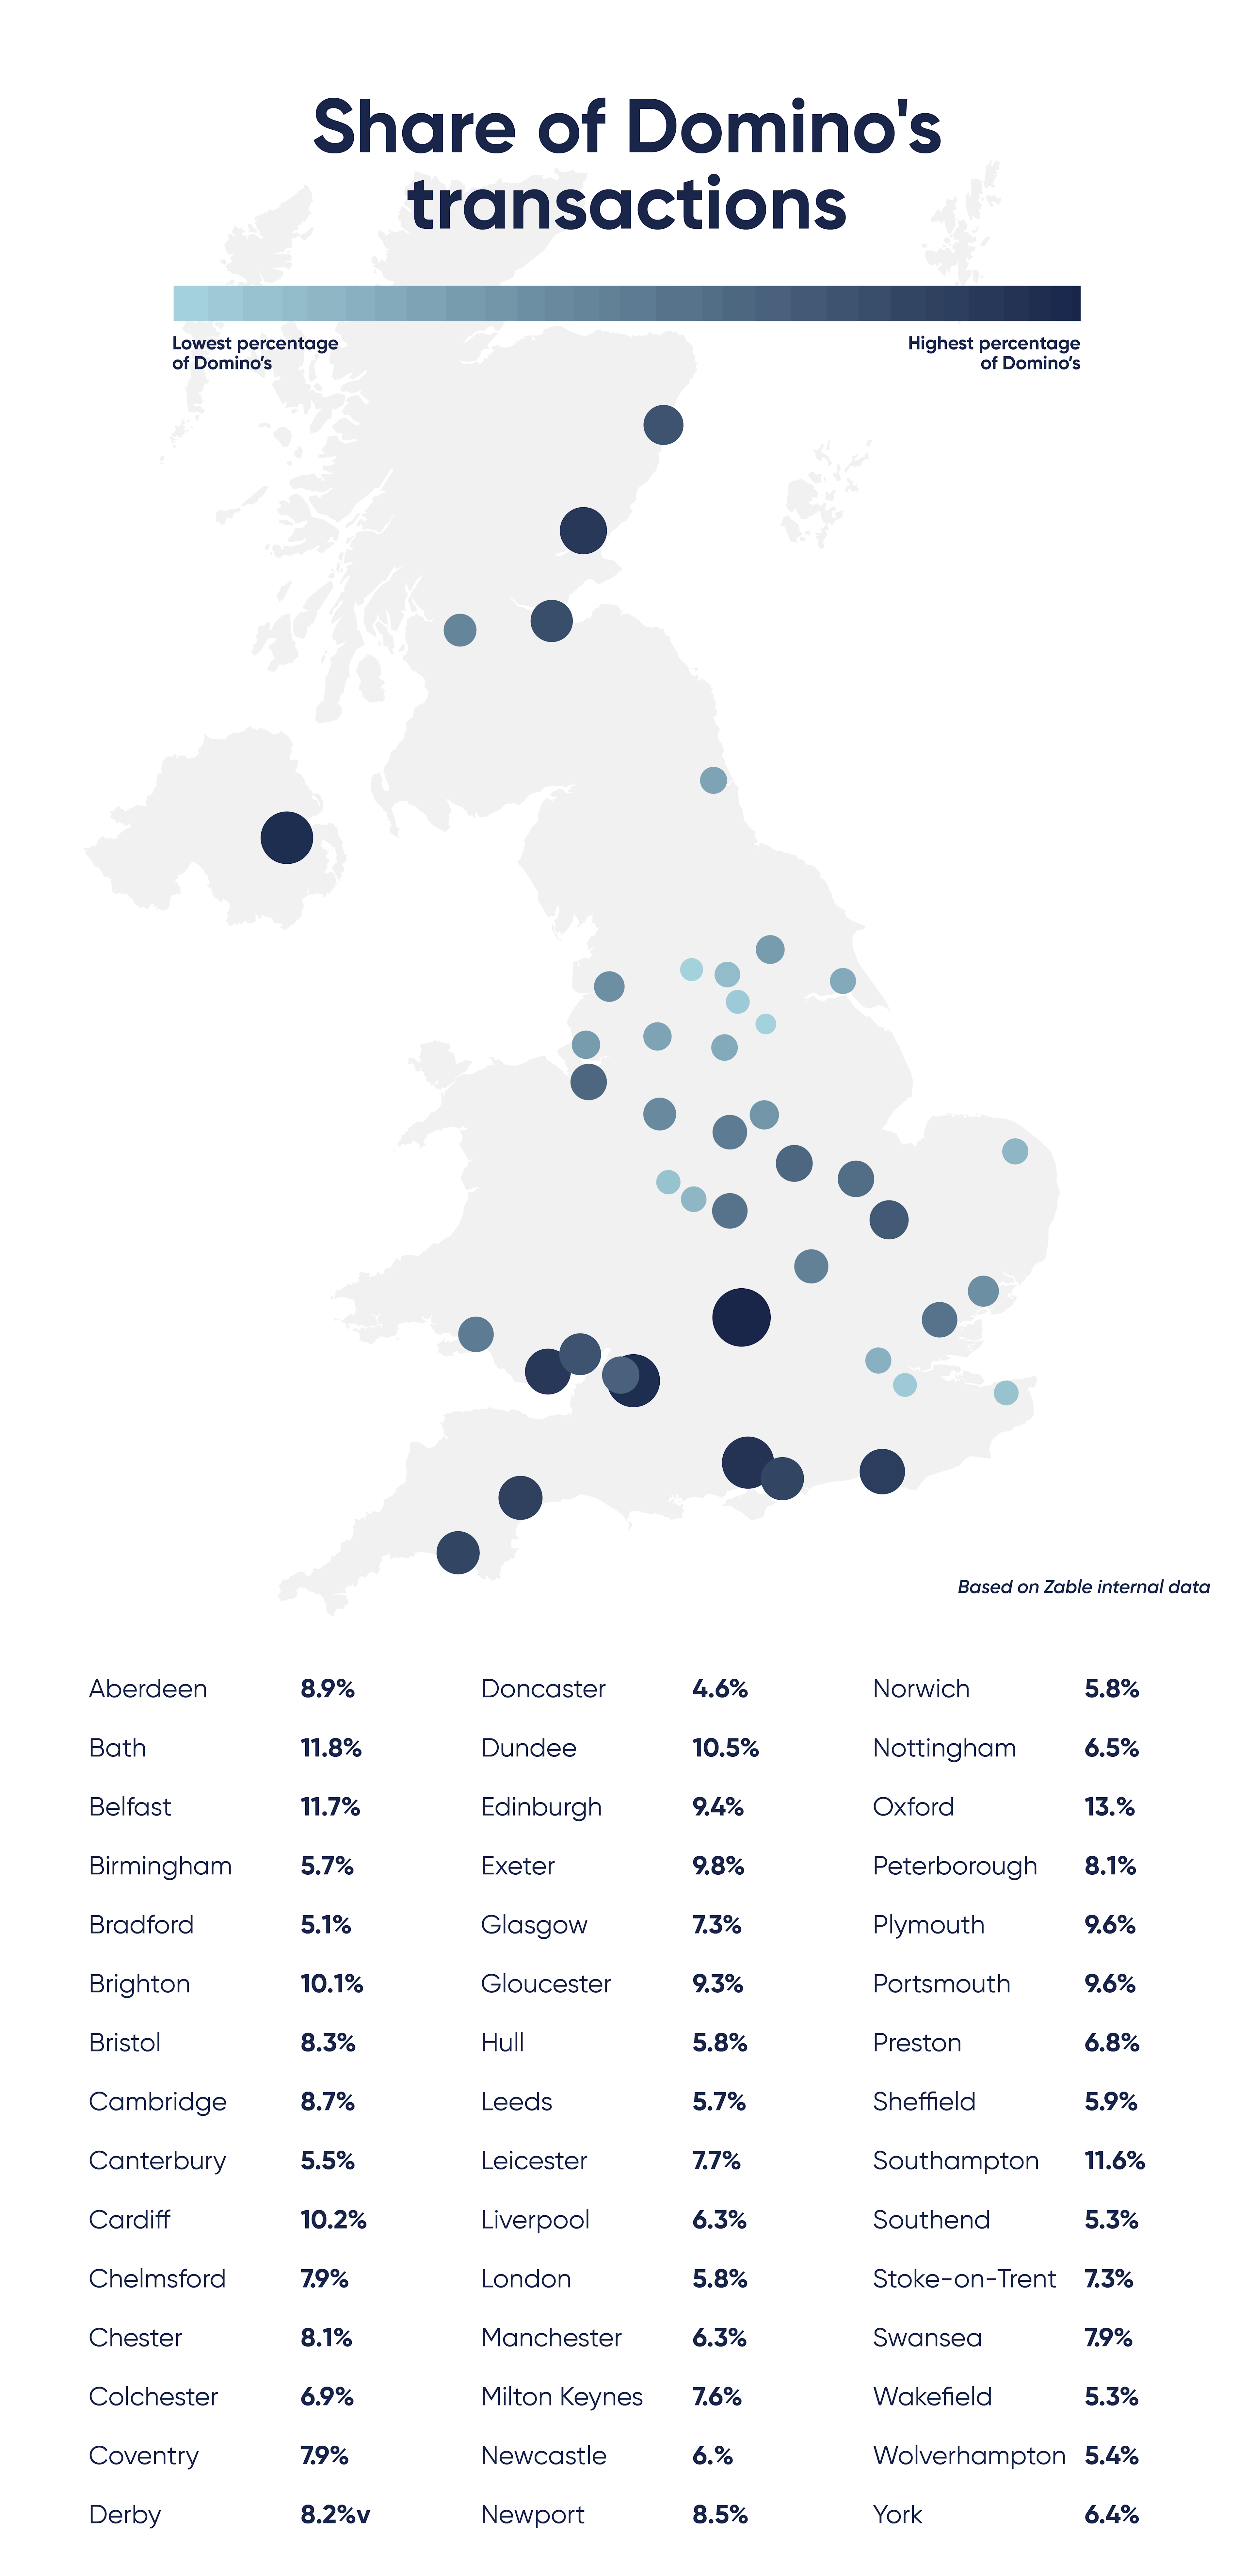
By contrast, some of Domino’s weakest-performing locations are concentrated in the north, including Blackburn (3.9%), Oldham (4.4%) and Wigan (6.1%).
The findings suggest that while McDonald’s remains Britain’s default fast food choice nationwide, regional spending habits continue to shape which takeaway brands consumers favour, with southern consumers appearing more willing to spend on premium-priced delivery chains such as Domino’s.
Age Group | Overall Market Share |
|---|---|
Under 30 | 17.96% |
30-39 | 32.98% |
40-49 | 29.48% |
50+ | 19.58% |
Under 30’s are the age group that have the lowest number of transactions at fast food shops, with those in their 30’s and 40’s purchasing the most, making up a combined 62.46% of market share.
How Britain’s coffee shop habits differ
Greggs is revealed as the most popular coffee shop, with over half of all Zable transactions analysed being made here.
Merchant | Overall Market Share |
|---|---|
Greggs | 52.60% |
Costa Coffee | 21.30% |
Starbucks | 13.30% |
Pret A Manger | 7.30% |
Caffe Nero | 4.40% |
Gails | 1.00% |
Whilst their most popular hour peaks at midday, perhaps due to people making the most of their baked goods offering, those who’re looking for their early morning caffeine fix are most likely to head to Costa Coffee, where 21.3% of all transactions take place.
The data shows that adults aged between 30 and 39 account for the largest share of coffee shop transactions across almost every major chain analysed, including Starbucks (35%), Gails (33%) and Greggs (32%).
Coffee shop preferences also vary noticeably across different parts of the UK. Perhaps unsurprisingly, Greggs takes the northern crown, accounting for 79% of transactions in Newcastle, 69% in Middlesbrough and 63% in Leeds.
London stands apart from most other major cities, with coffee shop spending spread far more evenly across multiple chains. In the capital, Greggs and Pret A Manger each account for 21% of transactions, while Costa Coffee maintains a similarly significant share of spending, creating a far more balanced market than elsewhere in the UK.
Costa Coffee also performs particularly strongly across southern locations including Portsmouth, Reading and Medway, where it captures close to a third of coffee shop transactions, significantly above its national average.
Taken together, the findings suggest Britain’s coffee shop habits are shaped less by age stereotypes and more by lifestyle, commuting behaviour and regional preferences.
The bottom line
While value-led supermarkets continue to dominate much of the UK, premium retailers remain closely tied to convenience shopping and older consumers. Fast food habits also vary significantly across the country, with McDonald’s dominating nationwide while brands such as Domino’s perform far more strongly in southern cities.
The findings also challenge several common assumptions around consumer behaviour, particularly when it comes to coffee spending. Rather than younger consumers driving the market, adults in their 30s and 40s account for the largest share of transactions across many major coffee chains.
Taken together, the data suggests Britain’s eating and shopping habits are increasingly shaped by affordability, commuting patterns and regional identity, reflecting wider lifestyle and economic divides across the country.
Sources and methodology
Methodology summary: To uncover how food shopping habits differ across the UK, the experts at Zable analysed internal consumer spending data across supermarkets, fast food chains and coffee shops.
The analysis explored transaction volumes, market share, purchase timings and demographic trends across major food and drink retailers, revealing how spending habits vary depending on age, location and daily routines.
Supermarket analysis The supermarket analysis examined transaction share and peak shopping times across major UK supermarket chains - Tesco, Sainsbury’s, Asda, Morrisons, Aldi, Lidl, Marks & Spencer Food and Waitrose.
City-level market share data was analysed to identify regional shopping trends and differences in supermarket loyalty across the UK. Age demographic analysis was also carried out to reveal which generations over-indexed with different supermarket brands.
Fast food analysis The fast food analysis examined spending patterns across major takeaway chains - McDonald’s, KFC, Domino’s and Burger King.
Transaction share by city was analysed to identify regional differences in fast food preferences, alongside peak transaction times to explore how consumers use different takeaway brands throughout the day.
Coffee shop analysis The coffee shop analysis explored transaction share, demographic trends and regional preferences across major coffee and grab-and-go chains - Greggs, Costa Coffee, Starbucks, Pret A Manger, Caffè Nero and GAIL’s.
Age demographic analysis was used to identify which age groups account for the largest share of coffee shop spending, while city-level market share data revealed regional differences in coffee chain popularity across the UK.
Internal data The data in this report is based on anonymised internal transaction data collected between 2024 and 2025.
Please note that individuals may hold multiple credit or debit cards and may use them to distribute their spending. This data is reflective of Zable credit card spend only.