Renting and credit in the UK: how renters compare with homeowners


Written by
Emily Tye
Reviewed by
Amy LancashireAnalysis of English Housing Survey, FCA and ONS data.
Around 17.4 million adults rent their home in the UK, and they're much less likely than mortgage holders to have a credit card: 52% compared with 78%, according to the FCA's Financial Lives 2024 survey. That's around 8.4 million renters without a credit card.
Yet private renters pay just as much for their homes. In England, the average private renter paid £250 a week in 2024-25, slightly more than the average mortgage payment of £242. In total, renters in England paid around £89 billion in rent that year, close to the £92 billion mortgage holders paid on their mortgages.
One difference is what shows up on a credit file. Mortgage payments appear on credit reports as standard, but rent only appears if it's reported. We combined the English Housing Survey, the FCA's Financial Lives survey and ONS population estimates to see how renters and homeowners compare.
Key statistics
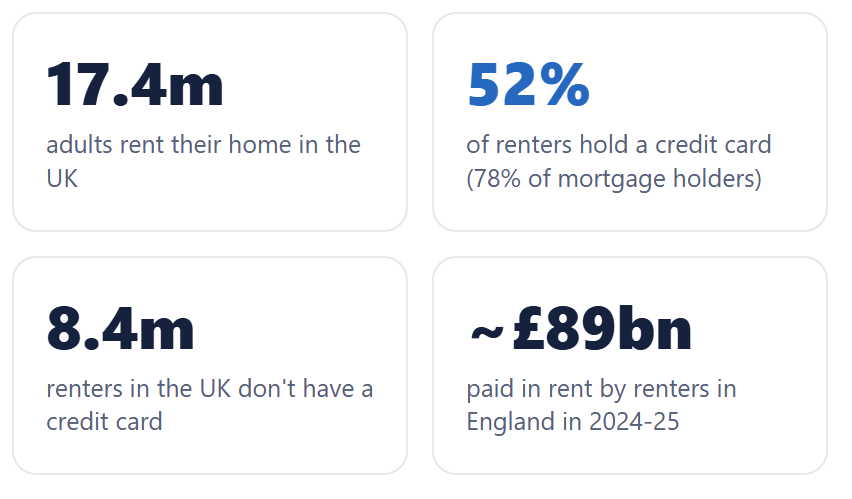
Around 17.4 million adults rent their home in the UK, 31.6% of adults (FCA and ONS, 2024).
52% of renters hold a credit card, compared with 78% of mortgage holders (FCA Financial Lives, 2024).
Around 8.4 million renters in the UK don't have a credit card (FCA and ONS, 2024).
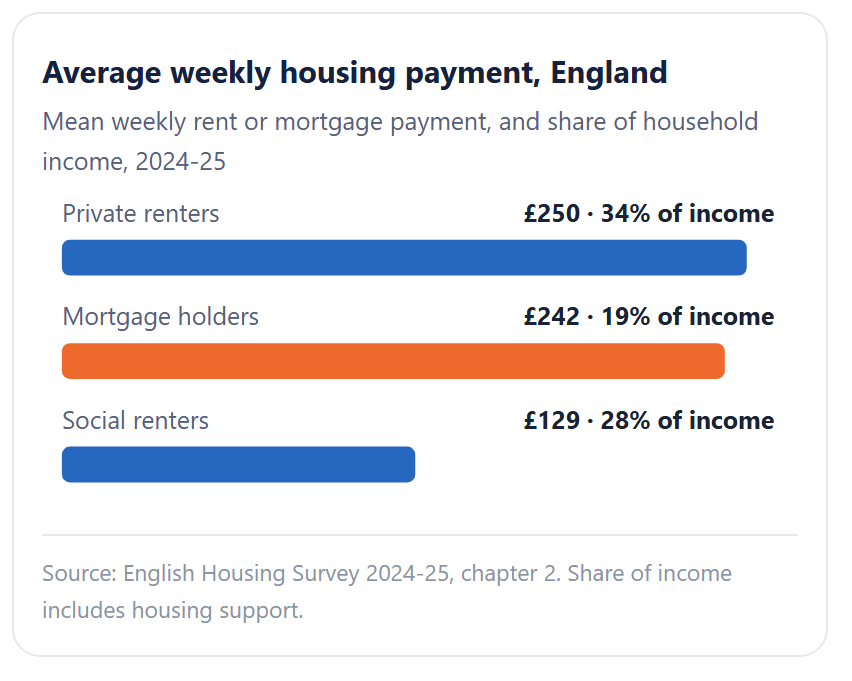
Private renters in England paid an average of £250 a week in 2024-25, more than the average mortgage payment of £242 (English Housing Survey).
Private renters spent 34% of their household income on rent in 2024-25, compared with 19% for mortgage holders (English Housing Survey).
Renters in England paid around £89 billion in rent in 2024-25, against around £92 billion in mortgage payments (our analysis of English Housing Survey data).
40% of renters checked their credit report or score in the year to May 2024, compared with 46% of mortgage holders and 21% of outright homeowners (FCA data tables).
How do renters' housing costs compare with mortgage payments?
In the English Housing Survey 2024-25, private renters in England paid an average of £250 a week in rent and social renters £129. Mortgage holders paid an average of £242 a week on their mortgages.
Rent also takes a bigger share of income. Private renters spent 34% of their household income on rent and social renters 28%, compared with 19% for mortgage holders. These figures count housing support as income.
Multiplying those averages by the number of households in each group gives the total paid in a year: around £61 billion by private renters and £27 billion by social renters, about £89 billion in all, against around £92 billion in mortgage payments.
Does paying rent build your credit history?
Despite the fact that millions of adults rent their home in the UK, paying rent does not automatically build credit history. Your credit report lists credit accounts such as mortgages, loans and credit cards, and how you've repaid them. Rent only appears if your landlord, letting agent or a rent reporting service shares it with a credit reference agency.
Once it's reported, rent can count. Experian, Equifax and TransUnion can all include reported rent, and all three say paying it on time can help your credit score.
How can renters build their credit history?
Check all three reports. Not every lender reports to all three agencies, so each may hold a different picture of you. Checking your own report doesn't affect your score.
Get your rent reported. Ask your landlord or letting agent whether they report rent, or use a rent reporting service.
Register to vote at your address. Being on the electoral roll helps lenders confirm who you are and where you live, so it's worth re-registering whenever you move.
How do renters compare with mortgage holders on credit?
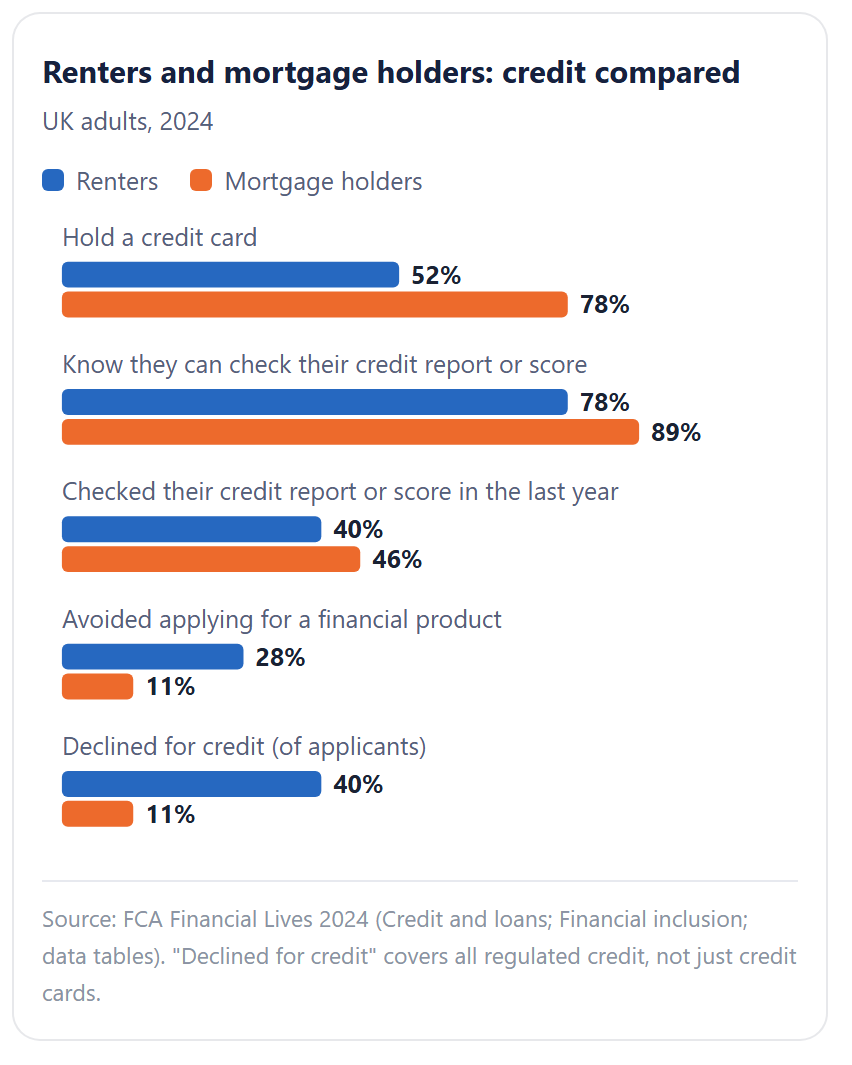
The FCA's data shows a clear gap between renters and mortgage holders across the UK.
Measure | Renters | Mortgage holders |
|---|---|---|
Hold a credit card | 52% | 78% |
Know they can check their credit report or score | 78% | 89% |
Checked their credit report or score in the last year | 40% | 46% |
Avoided applying for a financial product | 28% | 11% |
Declined for credit (of applicants) | 40% | 11% |
Renters were also more likely to hold back. In the two years to May 2024, 28% avoided applying for a financial product because they thought they wouldn't be eligible, couldn't afford it or would be turned down, compared with 11% of mortgage holders. Of those who applied for credit, 40% of renters were declined, compared with 11% of mortgage holders. That figure covers all regulated credit; our analysis of credit card acceptance rates looks at cards specifically.
Renting isn’t the only difference between the two groups. They also differ in age and income, so the data can’t show how much of the gap rent reporting would close on its own.
Do renters check their credit reports?
Most know they can. 78% of renters knew they could check their credit report or score, compared with 89% of mortgage holders, which leaves around 3.9 million renters who didn't know.
Renters were almost as likely as mortgage holders to have checked in the year to May 2024 (40% compared with 46%), and far more likely than people who own their home outright (21%).
About this data (methodology)
This combines the English Housing Survey, the FCA's Financial Lives survey and ONS population estimates. The housing cost figures cover England; the credit figures cover the UK. We never multiply one by the other.
Housing costs | Average weekly rent and mortgage payments, and share of household income: English Housing Survey 2024-25, chapter 2. Household numbers by tenure (annex table 1.1). |
Annual totals | Number of households × average weekly payment × 52. |
Credit | FCA Financial Lives 2024, a survey of UK adults carried out between February and June 2024 (Credit and loans; credit and loans data tables; Financial inclusion). The FCA's renters include anyone renting privately, from a relative or friend, or from the council or a social landlord. |
Population | UK adults (18+), mid-2024 (ONS Mid-Year Population Estimates). Share of adults who rent: FCA demographics data tables. Numbers of adults, such as renters without a credit card, are FCA percentages applied to the ONS adult population of 55.2 million. |
Figures are estimates from survey data. The English Housing Survey counts households; the FCA counts adults.
There are a range of financial products available that may suit your needs. We encourage you to research your options carefully and consider seeking independent financial advice before making any decisions. This blog is for informational purposes only and does not constitute financial advice.